AI in Marine Aquarium Monitoring: Data Analysis and Early Detection
How AI, computer vision, and intelligent sensors are revolutionizing marine aquarium monitoring by detecting problems before they cause losses.
The Monitoring Revolution: From Surface Tests to AI
Traditional test strips and surface water measurements are relics of the 20th century. You measure pH, ammonia, nitrates – you get a snapshot from 2-3 points in the aquarium. The problem? Toxic gas bubbles accumulate at the bottom, aggression between fish escalates at night, and the microbiome breaks down 48 hours before visible symptoms appear. Classic methods detect problems when you're already losing animals.
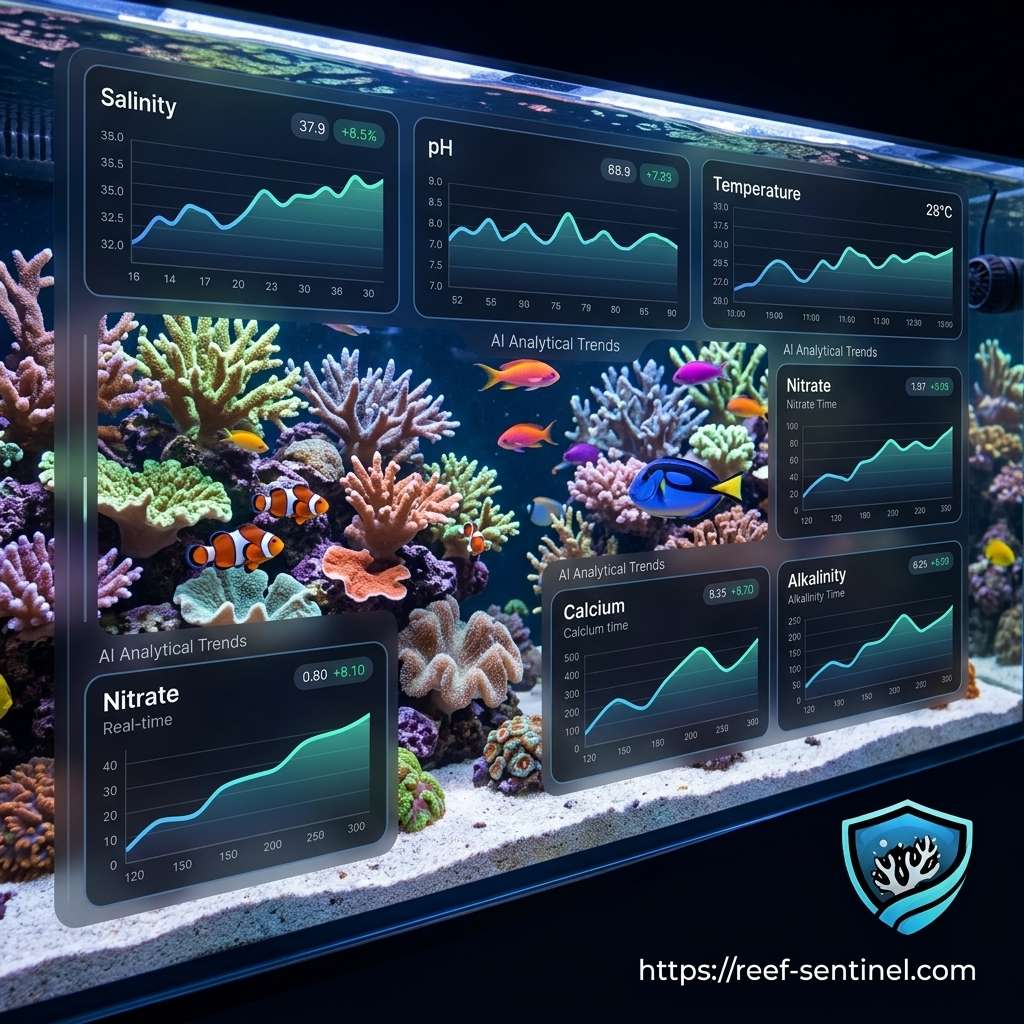
AI changes the rules of the game. Instead of waiting for a manual reading, AI systems process parameter data in real time directly on-device or within a dedicated application. Reef Sentinel – a marine aquarium monitoring platform – aggregates data from manual tests, sensors, Home Assistant integrations, and Sentinel Hub devices, generating trend maps and preventive alerts before parameters reach a critical point. It's like switching from a thermometer to a CT scanner.
Computer vision raises the bar even higher. Systems based on deep learning networks analyze test strips and reagents, eliminating the subjectivity of color reading under variable lighting. Zero errors caused by a tired aquarist's eyes. The system works 24/7, recording trends that a human would simply miss.
Data stream integration is the turning point. Reef Sentinel aggregates data from ICP, manual measurements, IoT device data, and tank events in a single dashboard. AI processes this mixture, forecasting nitrate and phosphate trends, while the consumption engine delivering SAFE/WATCH/RISK signals generates dosing recommendations based on actual consumption. You don't react to problems – you predict them in advance.
Behavioral data closes the loop. Pattern recognition can detect a slowed feeding response – an early stress marker invisible in chemical parameters. Reef Sentinel tracks behavioral events, building a timeline that correlates parameter changes with observed behaviors. This isn't monitoring – it's continuous ecosystem diagnostics.
Intelligent Parameter Analysis: From Data to Prediction
Manual water tests provide snapshots, but it's trends that save animals. The Reef Sentinel Smart Insights Engine 2.0 replaces descriptive threshold-only alerts with predictive alert objects based on time-axis velocity regression.
How does the predictive engine work? For each parameter, the system computes a velocity change vector (change/day) using linear regression on the time axis. For KH: drift detection through velocity thresholds and duration checks, baseline comparison, projected instability window. For NO3/PO4: ratio with a safe PO4 floor, trend direction check, projected days to critical ratio bounds. The confidence model (0..1) is based on trend duration, velocity magnitude, and data completeness.
The alert payload includes detected_pattern, risk_projection, confidence_score, and deterministic action text – not generic warnings, but specific instructions. The engine classifies instability phases: stable, minor_drift, instability_forming, instability_active, recovery_phase. The user doesn't just see "warning" but rather "you are in the instability-forming phase, intervene within 48 hours."
Event context changes data interpretation. When a sensor sees a PO4 spike, the system checks the event timeline: was there feeding? A water change? Filter maintenance? Event-aware root-cause context adjusts the confidence score and phrasing – weak correlations get cautious wording, strong correlations trigger precise recommendations. This eliminates false alarms that, in simple threshold-based systems, kill adoption through alert fatigue.
Computer Vision and Photo Diagnostics
Colorimetric test strips are the standard in marine aquariums, but reading them is a lottery – lighting, eye fatigue, subjective color judgment. A 0.5 ppm difference in phosphates in an SPS reef is the difference between health and RTN. Computer vision systems with architectures like RetinaNet solve this problem: a single-board computer analyzes a photo of the strip and classifies water quality without subjectivity.
RetinaNet is a deliberate architectural choice – an object detection model with focal loss that handles strong class imbalance. In the context of test strips, this means precise detection of colored fields even under variable lighting or partial shadow. The system trains on hundreds of strip photos under varying conditions, learning to recognize not just color but context – field position, intensity, gradients. This eliminates human error, which studies show reaches 15-20% when reading NO3/PO4 tests.
Reef Sentinel extends visual diagnostics with Photo Diagnostics (Vision). The user uploads a photo and selects the organism type: coral, fish, invertebrate, or tank_problem. The system fuses the image with the tank's latest parameters, trends, and event history, returning a structured output: problem_detected, confidence_level, possible_causes, recommended_checks. Instead of hours of scrolling Reef2Reef searching for similar photos, you get a preliminary diagnosis in seconds.
The real power emerges with ICP data integration. Reef Sentinel supports ICP/PDF import with an editable confirmation flow and contextual ICP pre-analysis (plan-gated to PRO/Premium). The system compares results with tank history, flags anomalies, and weaves ICP data into the overall trend model – Ca, Mg, Sr, and trace elements become part of the same predictive picture as daily KH tests.
Stability Algorithms: How Reef Sentinel Assesses Tank Health
The Reef Sentinel Stability Engine v2 calculates a Stability Score deterministically from parameter history – not as a magic number from an LLM, but as a transparent mathematical model with four components.
Score components:
- Threshold penalty – penalty for values outside the reference range
- Drift penalty – penalty for directional changes over time
- Volatility penalty – penalty for instability (oscillation without trend)
- Confidence cap – score reduction with sparse data
The score maps to statuses: stable/watch/warning/critical with a 7-day delta. The dashboard presents the Stability Score as the dominant hero card with inline impact summary: what specifically is pulling the score down (threshold/drift/volatility), compact OK/Warning/Critical badges under the score, recommended actions with confidence level and status.
Reef Health Overview combines four dimensions in one panel: System Stability, Dosing Alignment, Nutrient Balance, Model Confidence. Dosing Alignment checks whether current dosing is aligned with calculated consumption – a discrepancy is flagged as WATCH or RISK before parameter drift occurs. This closes the loop: you don't just see KH dropping, but the system indicates that dosing is too low and forecasts how many days until you reach the alarm threshold.
Consumption and Dosing Mechanism: Data-Driven Decisions
One of the most challenging aspects of marine aquarium keeping is dosing calibration. Corals consume Ca, Alk, and Mg in proportions that depend on biomass, growth rate, and temperature. Most aquarists rely on empirical tables and adjust manually – which takes months of trial and error.
Reef Sentinel Consumption Insights v2 replaces this with data-driven modeling. The system tracks actual_dosing_ml_per_day per solution, calculates actual consumption from parameter trends, and compares it to dosing. For multi-component solutions: uplift derivation per parameter is based on actual dosing volume, component concentration (increase_per_ml_per_100l), and tank volume.
Status-first UI (SAFE/WATCH/RISK) provides instant context: RISK when projected instability is ≤3 days, WATCH when ≤7 days. Confidence-aware guardrails: low model confidence holds back strong recommendations – the system doesn't recommend drastic changes based on 3 measurements from the past 2 weeks. Stabilization gating after fresh dosing changes: minimum data requirements before actionable recommendations, to avoid generating false alerts after a manually applied correction.
The dosing calculator (plan-gated) computes correction and maintenance doses based on the active tank and saved solutions. Presets for popular AIO products: autofill eliminates manual transcription of concentrations from labels. For reef keepers working with balling, the system supports multi-component solutions with dedicated calculators per parameter.
Data Integration and Unified Dashboard
Most marine aquarists know this problem: ICP test data in a PDF, test results in a notebook, Apex controller measurements in the cloud, and observation notes in Excel. Data fragmentation isn't just organizational chaos – it's lost opportunities to detect correlations between parameters.
Reef Sentinel aggregates dispersed sources into a single dashboard. The system integrates with Home Assistant via webhook API (temp/pH/salinity/ORP with normalization and a dedupe guard for rapid writes), with Sentinel Hub (Reef Sentinel hardware, bidirectional API with telemetry upload, display fetch, command polling), and with Reef Sentinel Lab (hardware integration with activation packs via promo codes). The key value lies in the analytics layer: AI uses historical data to forecast nutrient trends.
ML Dataset Builder closes the analytics loop. Each new data point feeds into timestamped supervised-learning samples with normalized and raw parameter snapshots, derived metrics (kh_velocity, nutrient ratio, stability score, phase confidence), and context features: tank context (tank_age_days, system_volume_liters), event timing context (hours_since_*), data quality (measurements_last_7d, measurements_last_30d). Over time, the model learns patterns specific to your tank – Ca/Alk/Mg consumption ratios, typical spikes after water changes, seasonal circulation changes.
Public Tank Profile (Tank Sharing) closes the social loop. A public profile by slug (/t/{slug}) or temporary sharing link (/s/{token}) exposes parameters, event timeline, livestock, and status badge. Data is denormalized and refreshed after each save – the community can follow your reef in real time, and you can compare trends with other tanks on similar setups.
Behavioral Pattern Recognition: AI as an Early Warning System
Reef Sentinel tracks behavioral events as a full-fledged dimension of tank data, not just notes. The structured event model supports: organic_input, parameter_adjustment, system_change, biological_change, maintenance, unknown – each event has an impact category that influences the interpretation of parameter anomalies.
Event-aware insight correlation works in both directions. When a parameter spikes, the system checks event time windows (anomaly-to-event matching windows by impact category) and maps parameter relevance to event categories. The probable cause is phrased with confidence-aware fallback: "Likely related to partial water change 6h ago (medium confidence)" vs. "No identified event – check circulation and skimmer (low confidence)."
A slowed feeding response is a classic early stress marker. The event timeline lets you correlate behavioral observations with parameters: the aquarist logs "fish not responding to food" as an event with impact_category biological_change, which triggers predictive analysis in the time window. Visible disease symptoms typically appear 48-72 hours after the first behavioral signals – that gap is the intervention window.
Smart Alert Emails for Pro users close the notification loop. Parameter-risk detection for KH decline/instability triggers a branded HTML alert with a headline, explanatory insight block, action suggestion, and confidence-aware wording. Anti-spam cooldown per tank and alert pattern prevents alert fatigue – the system doesn't send 20 emails in a week about the same trend.
Implementation Challenges and Technical Architecture
Reef Sentinel addresses four main implementation challenges of traditional monitoring.
Data fragmentation. The platform handles ICP/PDF import with an editable flow, webhook ingestion from Home Assistant, native integration with Sentinel Hub hardware, and batch parameter entry. All data streams normalize to a common parameter schema with canonical storage (salinity in ppt with SG conversion for UI).
Analytics latency. The Insight Pipeline runs as a background job (insight_generation_job.py) scanning tanks with recent writes, updating the insight cache and phase history, upserting user-visible insight documents, and generating ML training samples. Scheduled-job runtime with Firestore-coordinated lease eliminates duplicate concurrent execution. Users see current insights without waiting for a manual refresh.
Alert fatigue. Consumption recommendation safety guards: post-change stabilization gating, minimum post-change data requirements before actionable recommendations, adjustment clamping to safe bounds. False positives are filtered by context-aware interpretation: the system "knows" about feeding, water changes, and filter maintenance, adjusting thresholds during those time windows.
Cost and scalability. Edge-first architecture reduces cloud costs. Next.js is the primary UI, FastAPI handles domain logic, and the Cloudflare Worker provides edge routing and HTML rewriting. Firestore read hygiene (compact select(...) reads, bounded queries, snapshot-first dashboard reads) minimizes read costs as the user base grows. Offline mode with an IndexedDB queue ensures system operation even with unstable connections – critical for remote aquarists or during router maintenance.
Practical Checklist: Implementing AI in Aquarium Monitoring
Plan Selection and Configuration
Reef Sentinel offers two paths: Reef Journal (Free) – basic parameter tracking, history, events; Reef Stability Engine (Pro) – full access to Stability Engine v2, Consumption Insights, AI Insights, Smart Alerts, dosing calculator, and ICP import.
For new tanks: start with 2 weeks of baseline data before enabling dosing recommendations. The system requires minimum data before generating actionable recommendations (post-change data requirements). Add first KH tests + optionally NO3/PO4/Ca through the onboarding flow.
Minimum Viable Sensor Setup
Home Assistant integration is the fastest path for users with existing IoT infrastructure. API-key per tank, webhook endpoint POST /api/integrations/home-assistant/webhook handles temp/pH/salinity/ORP with normalization. Dedupe guard for rapid writes eliminates noise from high-frequency sampling sensors.
Sentinel Hub (Reef Sentinel hardware) provides native integration with bidirectional API: telemetry upload, display fetch, command polling. Multi-tank/multi-device model with tank_id and device_id in the payload. Activation packs via promo codes.
For basic monitoring without IoT: manual KH tests 3x/week + NO3/PO4 1x/week are sufficient for Consumption Insights and Stability Engine to function after 3-4 weeks of data.
ICP Analysis Workflow
ICP/PDF import: upload → editable confirmation flow → contextual pre-analysis (trend-aware risk from recent tests and events, context confidence score low/medium/high). The system parses 35+ parameters and integrates them into tank history. Pre-analysis only runs on explicit user trigger (no auto-run) and is gated to PRO/Premium.
Workflow: ICP every 4-6 weeks → import → review pre-analysis → correct trace elements if flagged → track trends through the Stability Engine.
Success Metrics: What to Measure and How
Livestock loss reduction: baseline mortality rate before implementation vs. after 6 months. Realistic target: -30% for community tanks, -50% for high-value specimens (Acropora colonies >$130).
Early detection rate: % of problems detected >24h before visible symptoms. Smart Insights Engine with velocity regression achieves KH drift detection 3-5 days in advance on typical tanks.
False positive management: Consumption Insights with confidence-aware guardrails and stabilization gating significantly reduces false positives. Monitor alert history and tune custom thresholds for your tank after accumulating 30+ days of data.
ROI calculation: system cost (Pro plan ~$8-15/month) vs. prevented losses. One saved Acropora colony ($130) + avoided tank crash ($500 livestock) = system pays for itself in the first year.
References
- AI Smart Aquarium Management: 20 Updated Directions (2026) - Yenra
- Coral Reef Surveillance with Machine Learning: A Review of Datasets, Techniques, and Challenges
- Leveraging artificial intelligence to enhance marine biosecurity
- Data to Knowledge in the Ocean: How AI and External Data Shape Marine Biology Research
- The artificial intelligence of things and its aquaculture applications - Responsible Seafood Advocate
- Oceanography and Underwater Robotics with AI
- Exploring opportunities of Artificial Intelligence in aquaculture
- Use of Artificial Intelligence in Predictive Maintenance for Marine Engineering
Comments
Comments are powered by Cusdis. The widget only loads after you click.