Predictive Analytics in SaaS: How Forecasting Supports Product Development
The predictive analytics market is growing around 20% a year, and machine learning is changing how SaaS products get planned. What already works, what's still missing, and where your team should start.
Introduction: From Dashboards to Decision Systems
Colorful dashboards aren't enough anymore. They show what happened, while product teams need an answer to a different question: what should we do next? Predictive analytics is changing noticeably. It started as a way to report on the past and is becoming part of how decisions get made. As one analysis puts it, what separates high-performing SaaS businesses is not whether they use AI, but whether prediction influences real decisions across product, finance, support, and commercial operations[6]. The newest machine learning approaches can already predict how a new product will perform in its first and second year after launch, and estimate cannibalization and net growth along the way[1].
This isn't a passing trend. The predictive analytics market is growing at roughly 20% a year[2][4], and the subscription model has put this kind of analytics within reach of mid-sized companies, not just enterprises. Product teams don't want to run their own infrastructure. They want an API that plugs into Mixpanel, Amplitude, or their own warehouse and returns a forecast when they need one.
The biggest change, though, is in the question we ask the data. Instead of "how many users churned last month?" we ask "which cohort is most likely to churn in Q2, and which feature do we need to fix to change that?". Models combine usage patterns, lessons from past launches, and market data to support specific choices: what goes on the roadmap, when to ship, how much budget to put into development. Reporting turns into decision intelligence.
A New AI/ML Approach to Product Forecasting
Most SaaS product teams still treat forecasting like a rear-view mirror. They look at historical metrics and extend the trend in a straight line. The trouble is that by the time a retention drop shows up in your data, the market has already moved. What you need is a system that estimates demand before you commit a quarter of engineering time.
A good example was presented on September 14, 2026, at the Marketing Science Institute's Analytics and Forecasting 2026 conference in New York. A team from Kenvue (the consumer health company behind brands like Listerine and Neutrogena), together with Cloverpop, presented an AI/ML approach to forecasting demand for new products[1]. It brings syndicated point-of-sale (POS) data, historical launches, execution variables, and AI-enriched product attributes into a single decision-intelligence platform. From there it forecasts Year 1 and Year 2 performance while estimating cannibalization and net-new incremental sales[1]. Beyond better accuracy, the authors point out that it enables faster concept evaluation and scenario simulation, and reduces dependence on costly concept-testing studies[1].
The approach comes from consumer goods, but it maps onto SaaS easily. You learn not just whether feature X will get used, but whether it will bring in new customers or simply pull users away from feature Y. The difference from classic A/B testing is fundamental: you get the forecast before anyone writes code, not after a three-month experiment on half your users.
Roadmap planning is where this pays off most. Instead of a PRD built on customer feedback and a PM's gut, you get numbers. A hypothetical output might read: "Feature A: 12–18% ARR growth in Year 1, 8% cannibalization of the Enterprise plan, net growth +4%". Portfolio decisions stop being political, because the model shows which initiatives will bring in revenue, which will eat into existing lines, and which will turn out to be zero-sum.
To me this is the natural next step for product analytics. Mixpanel and Amplitude tell you what happened. The new generation of tools tries to tell you what will happen if. It's the difference between a post-mortem and a pre-mortem, between reacting and deliberately shaping the outcome.
Keep in mind that a model like this needs data: a meaningful history of past launches, clean adoption and churn data per feature, and connections to your CRM and billing system. A SaaS company that has been around for a few years usually has all of this sitting somewhere. The real question is whether it's being used for forecasting, or only for explaining to the board what went wrong in Q3.
Market Dynamics: Numbers and Adoption
The market for SaaS-delivered business analytics is growing fast. According to Precedence Research, it's worth $16.42B in 2026 and expected to reach $60.52B by 2035, a compound annual growth rate (CAGR) of 15.6%[3]. Predictive analytics accounted for 35% of that market in 2025 and is expected to grow faster than the category as a whole, at 17.5% a year[3].
Estimates for the broader predictive analytics market (not just SaaS) depend on the source. Precedence Research projects growth from $21.24B in 2026 to $113.46B in 2035 at a 20.56% CAGR[2]. Fortune Business Insights puts it at $27.56B in 2026 and $116.65B in 2034 at a 19.8% CAGR[4]. The gap comes from different category definitions, but the direction is clear. Forecasting is moving out of the BI department and into product, customer success, and revenue operations.
It's also clear where these tools run. According to Fortune Business Insights, cloud deployments hold over 79% of the predictive analytics market in 2026[4]. Heavy on-premise installations that took months to integrate are giving way to subscription platforms. For small and mid-sized companies, that's a big shift. Instead of a large budget for a custom build, they can start with a subscription and scale as the return shows up.
Vendors also no longer compete on price alone. They build forecasts into the tools product managers and RevOps teams already use every day. Salesforce Einstein is a good example, widely used for lead scoring and opportunity forecasting right inside the CRM[6]. Instead of a separate "analytics" dashboard, churn risk shows up in the customer success panel, expansion forecasts in the CRM, and predicted feature adoption in product analytics. In my view, that integration is what drives adoption. A tool that lives in your daily stack beats the most sophisticated standalone product sitting off to the side.
Key Applications in SaaS Product Development
Churn prediction is the most commonly described use of predictive analytics in SaaS[5][9]. It's also no longer just a customer success concern and increasingly shapes roadmap priorities. Models look at product usage signals: login frequency, how deeply an account uses individual features, shifts in activity. They combine those with contract data and produce a risk score for every account. Imagine a large share of your Enterprise customers aren't touching the new API integration and their risk scores are climbing. The signal is clear. Either the onboarding for that feature needs to be simpler, or the feature doesn't solve a real problem for these customers.
Upsell and cross-sell are the second pillar: customers moving to a higher tier or buying additional modules[5]. Instead of guessing who's ready, models pick up the behaviors that usually come before an upgrade. These might include approaching the API call limit, adding more users to the team, or exporting data more and more often. If a model flags such an account a few weeks ahead, there's time for a thoughtful, tailored conversation instead of a cold call.
Predicting feature adoption closes the feedback loop[5]. Before a feature reaches everyone, you study the beta cohort. Which segments (by firmographics, usage patterns, tech stack) pick it up fastest, where people drop off during onboarding, and how the feature affects retention in the first few weeks. That lets you fix the onboarding flow and messaging before launch, rather than scrambling once adoption stalls.
The hardest case is cannibalization from pricing changes. Say you add a mid-market plan between Starter and Enterprise. How many Enterprise customers will downgrade, how many Starter customers will upgrade, and how much new revenue will be left at the end? An approach similar to Kenvue's, combining launch history, execution variables, and product attributes, can separate cannibalization from real growth[1]. Without that, you're deciding on instinct, and it's easy to miss a falling ARPU hiding behind a growing customer count.
The key is combining signals from three layers:
- product usage: event stream, feature flags, session length and depth,
- market data: competitive intelligence, category growth, buyer intent signals,
- launch history: what worked in past releases and which cohorts converted.
Companies that keep these in separate dashboards lose the context. The best implementations go a step further and build systems that don't just forecast but recommend actions. For example: "delay the launch of feature X by a few weeks, because segment Y shows low predicted uptake" or "speed up onboarding for the accounts with the highest risk scores".
Architecture of Modern Forecasting Systems
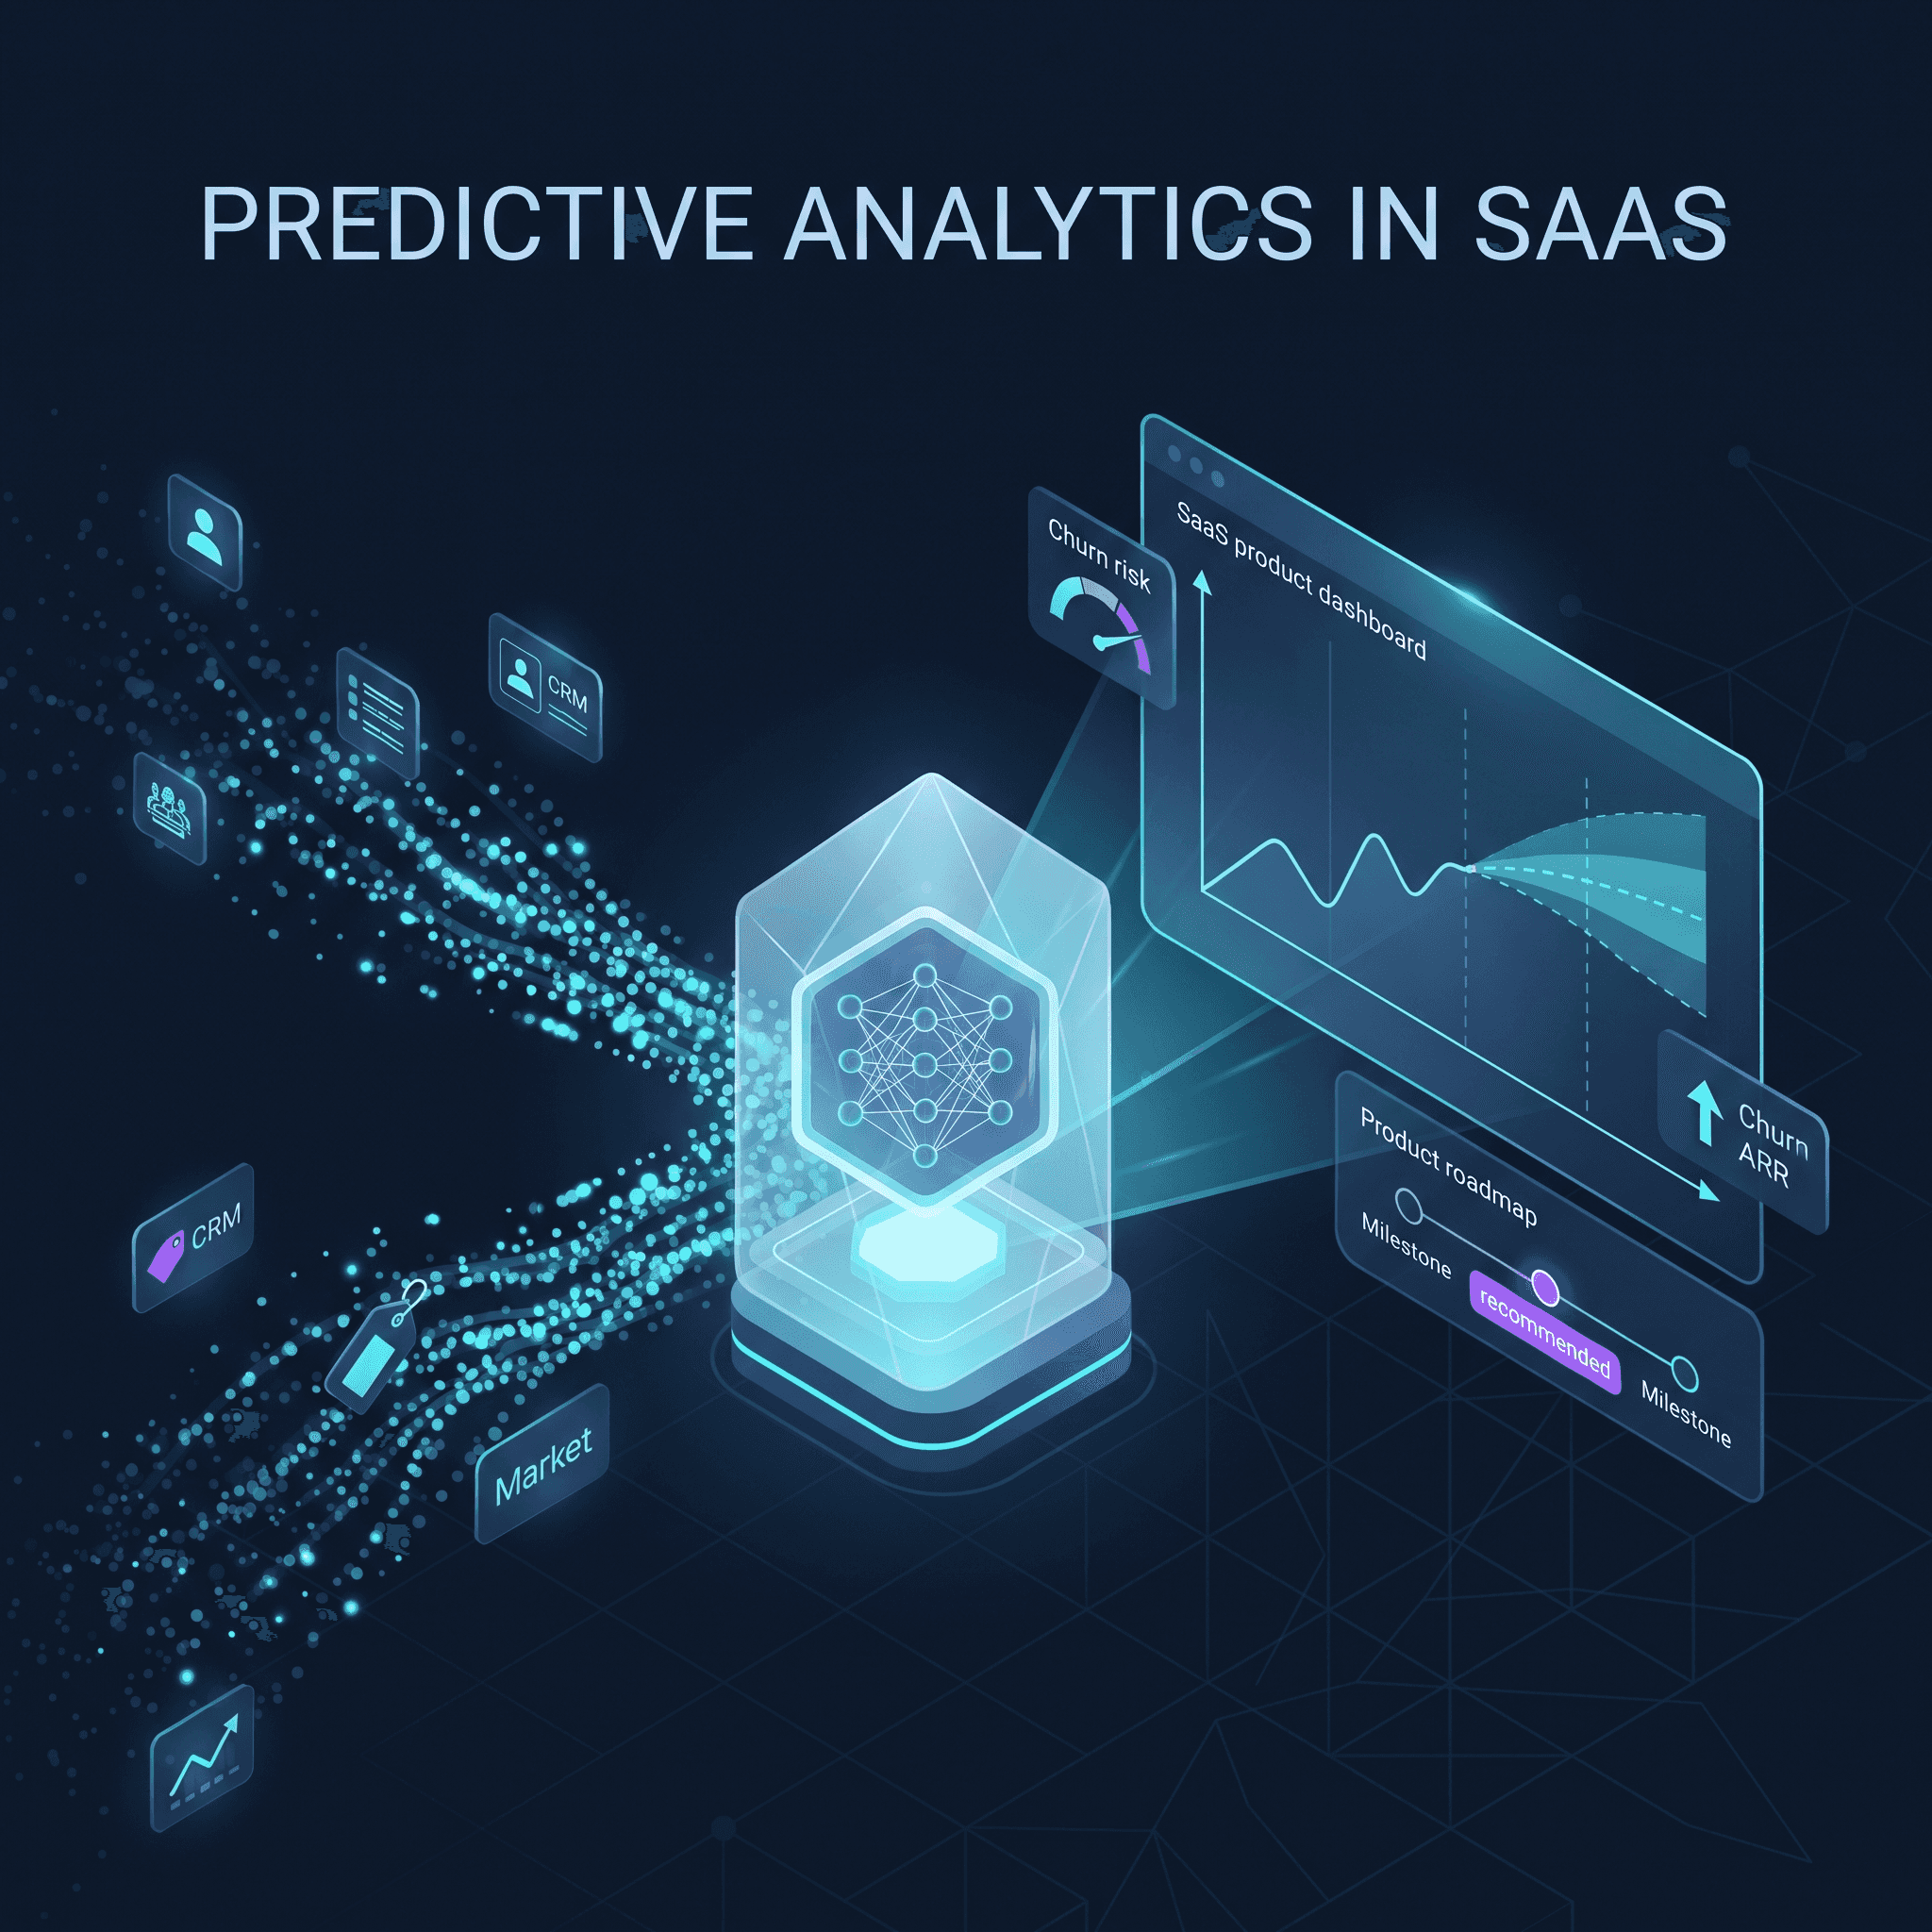
Forecasting systems in SaaS have moved from simple trend charts to decision platforms that shape the roadmap, launch timing, and how budget is split across features. They combine three data layers: product usage metrics (clicks, sessions, feature adoption), market signals (demand sensing, competitor moves), and AI-enriched product attributes. That last one means richer product metadata, which lets a model predict not only whether a feature will catch on, but how much it will cannibalize existing functionality.
In practice it looks like this. A collection layer joins the product event stream (Segment, Amplitude) with CRM data and support tickets. Then feature engineering adds context to raw events: user cohort, lifecycle stage, pricing plan, engagement score. Only then do the machine learning models run, ranging from simple regressions, through gradient boosting (XGBoost, LightGBM), to ensembles that combine churn, expansion, and product-market fit predictions. In smaller companies, careful feature engineering and a single well-tuned gradient boosting model usually beat an elaborate ensemble built on weak data.
Real-time forecasting changes how customer success and RevOps work. Instead of waiting for the end of the quarter, a CSM might get an alert like: "an account worth $50K in ARR has a 73% probability of churning within 30 days". Along with the reasons: a 40% drop in daily active users, no adoption of a new feature, an escalated ticket. The reasons are the valuable part, because a bare score rarely leads to action. RevOps, in turn, can see a pipeline forecast updated from product activity, not just deal stages in the CRM.
The most important shift is the move from descriptive analytics (what happened), through predictive (what will happen), to prescriptive, which suggests a concrete action. The system doesn't stop at "churn risk: high". It proposes a next step, for example: "run onboarding flow B for the Enterprise trial segment, because it has historically converted better". Models learn from A/B test results, close the feedback loop, and keep improving product decisions as they go. Forecasting stops being solely a finance task and becomes part of product development[6]. You're no longer just predicting revenue, but also which feature to build in Q3 to improve retention in Q4.
Gaps in the Current Ecosystem and Where It's Heading
The ecosystem is moving fast, but it still lacks the foundations it needs to scale. The biggest problem is the near-total absence of credible case studies with measured ROI. Ask how much retention improved after a company rolled out cohort forecasting, and you'll usually get marketing language instead of hard numbers. A typical example: you can read that spreadsheet forecasts reach 60–70% accuracy while AI-powered systems hit 90% or more[7]. What's missing is how that was measured, on what data, and over what horizon.
Peer-reviewed research from recent months that focuses specifically on SaaS barely exists. The Kenvue approach mentioned earlier is a conference presentation from the consumer goods industry, not a peer-reviewed paper, and it deals with products sold in stores, not subscriptions[1]. There's no equivalent yet for MRR, expansion revenue, or product-led growth metrics.
The industry badly needs standards for cohort-based forecasting and causal inference. Right now every vendor defines "predicted churn" its own way. Some use a 30-day window, others 90 days, and others mix behavioral and firmographic signals without a clear methodology. There's no shared language for comparing models, let alone reproducing results.
At the same time, there's growing pressure to connect forecasts to the rest of the business. They can't live in isolation. They should be wired into billing, procurement, and financial planning[8], shape the roadmap, trigger automated playbooks in customer success, and inform pricing decisions. Cheaper subscriptions are opening these tools up to smaller companies, but without quality standards it's easy to end up with more noise than signal.
In my view, the biggest gap is the missing bridge between academic causal inference and production machine learning in SaaS. We need better models, but we also need clear decision rules: when a forecast should change a feature's priority, and when it's just noise in the data.
Practical Takeaways: A Checklist for Product Teams
1. Readiness: Do You Have a Data Foundation?
Before you invest in forecasting, check three areas: launch and release history (cohort data, ideally covering at least a year), product signals (event tracking at the feature level, not just pageviews), and market signals (competitive intelligence, segment trends). Without these, you're building on sand.
The strongest models combine product data with market data. The Kenvue example shows how sales data, launch history, and AI-enriched product attributes can predict Year 1 and Year 2 results along with a cannibalization estimate[1]. The SaaS equivalent looks like this: usage data + market benchmarks + launch history = expansion and churn forecasts per segment.
2. Deployment Model: SaaS or On-Premise?
With cloud already holding the vast majority of this market[4], proven tooling is available off the shelf, on subscription, with no infrastructure spend.
On-premise really only makes sense under regulatory constraints, or when you have your own data science team and want full control over feature engineering. For most SaaS products, it's better to start with an off-the-shelf platform and move to custom models only once the standard ones stop being enough.
3. Priorities: Where to Start
Three use cases that are easiest to start with[5][9]:
-
Churn prediction. Identify at-risk customers early and trigger automated customer success playbooks. A practical caveat: churn is usually rare, so accuracy on its own can mislead. A model that always answers "this customer stays" will also score high. Look at precision and recall instead.
-
Expansion forecasting. Predict which accounts will move to a higher tier next quarter. This feeds the pipeline directly and lets the product team shape onboarding around the expansion path.
-
Feature adoption. Estimate what share of each segment will start using a new feature before you roll it out to everyone. Less effort goes into features nobody needs.
Start with one use case and a clear success metric, for example "reduce logo churn by 15% within 6 months". Don't try to build a do-everything platform on day one.
4. Integration: Your Systems Have to Talk to Each Other
The predictive layer only works when it connects product analytics (Amplitude, Mixpanel), the CRM (Salesforce, HubSpot), and the data warehouse (Snowflake, BigQuery). If those systems don't share customer IDs and consistent event schemas, start with data governance. Otherwise your models will learn from bad joins.
Off-the-shelf analytics platforms automate this whole pipeline: ingesting data from multiple sources, building features, refreshing models on a schedule, and delivering scores to the tools your team already uses. Look for vendors with pre-built connectors to your stack. Writing custom ETL from scratch is a trap that can eat months.
5. Skills: Decision Intelligence vs. Traditional BI
Traditional BI tells you what happened. Decision intelligence tells you what to do. A product team needs people who understand causal inference (what actually drives retention and what's mere correlation), experiment design (how to validate forecasts with A/B tests), and model interpretation (why the model flagged this particular segment).
You don't need a team of PhDs. To start, a product manager with solid SQL and basic statistics plus an analytics engineer comfortable with dbt and feature pipelines is enough. Advanced models such as churn prediction or customer lifetime value (LTV) can be bought from SaaS vendors. Build in-house only the logic that's specific to your domain.
6. Success Metrics: How to Measure ROI
Measure on three levels.
Model quality: precision and recall, probability calibration, and above all a comparison against a simple baseline (e.g. "last quarter × 1.1"). If the model doesn't clearly beat it, don't ship it.
Impact on the team: how many days pass between a signal and a decision, what share of the team actually uses the forecasts, and how quickly the model learns from new data.
Business outcomes: whether features prioritized with the model's help see higher adoption, how much ARR expansion plays brought in, and how much cost was avoided through lower churn and less spending on acquiring replacement customers.
Set a baseline before rollout and compare quarter over quarter. If after 6 months you see no measurable improvement in retention or expansion revenue, change course or shut the project down. Forecasting for its own sake is a waste of time and money.
References
- Analytics and Forecasting 2026 – Marketing Science Institute (session "Closing the Innovation Forecast Gap: An AI/ML Approach to New Product Forecasting and Incrementality at Kenvue", Sept 14, 2026)
- Predictive Analytics Market Size, Share and Trends 2026 to 2035 – Precedence Research
- SaaS-Based Business Analytics Market Size, Share and Trends 2026 to 2035 – Precedence Research
- Predictive Analytics Market Size, Share | Industry Report 2034 – Fortune Business Insights
- 2026 SaaS Predictive Analytics: Use Cases & More – Qrvey
- Predictive AI for SaaS Companies: Growth, Churn Prediction & Revenue Forecasting – Vegavid
- AI-Powered Revenue Forecasting: Machine Learning for SaaS Predictions – MRR.ai
- How SaaS AI Analytics Improves Forecasting for Growth, Retention, and Operations – SysGenPro
- Use Cases of Predictive Analytics in SaaS Platforms – Adlega
Comments
Comments are powered by Cusdis. The widget only loads after you click.